


Recently, various demographics have seen an upsurge in the frequency of spine procedures [1]. The use of the Wilson frame to perform the prone position can allow the airway pressure to be decreased and lung compliance improved. However, it might result in physiological changes that make it difficult to maintain adequate intraoperative fluid management [2]. Moreover, inappropriate fluid replacement could increase the risk of hypotension and decrease perfusion to the kidney and other vital organs, leading to organ dysfunction. On the other hand, excessive fluid administration has been linked to an increase in the risk of pneumonia and respiratory failure, as well as an increase in renal work, intestinal oedema, postoperative ileus, decreased tissue oxygenation, and delayed wound healing [3].
It is challenging to anticipate a patient’s reaction to intraoperative fluid resuscitation using static indicators such as central venous pressure [4] due to their poor predictive ability despite being invasive [5]. On the other hand, some studies have shown that dynamic indicators based on heart-lung interactions can be helpful in predicting fluid responsiveness in mechanically ventilated patients [6–9]. However, these techniques are either intrusive, rely on sophisticated equipment, or are unreliable when the patient is prone.
The plethysmographic variability index (PVI) is another dynamic approach for assessing volume status that has been examined in many clinical contexts and has shown dependability in predicting fluid responsiveness and serving as a guide for fluid resuscitation [10, 11].
One of the most popular protocols is conventional fluid management (CFM), which replaces fluid in accordance with clinical evaluation, heart rate (HR), arterial blood pressure (ABP), and central venous pressure monitoring. Clinical research has shown, nevertheless, that ABP variations cannot be employed to monitor cardiac output or stroke volume [12]. Goal-directed fluid management (GDFM), a different approach, is based on tailored fluid management with the use of static and dynamic factors [13]. In the present study, we compare the CFM and PVI-based management in terms of intraoperative fluid management in the prone position during spine surgery regarding their response to haemodynamics and organ perfusion.
As a result, the aim of this study is to compare the CFM and PVI based GDFM during elective spine surgery in the prone position.
METHODS
All patients provided their written, informed consent after receiving approval from the Research Ethics Committee of the Faculty of Medicine at Cairo University (email: kasralainirec@gmail.com ID: MD-179-2020). The study was registered at clinicaltrials.gov (NCT05239286). For this randomised controlled trial, the standards of the Consolidated Standards of Reporting Trials (CONSORT) were followed. The participants were adult patients (over 18 years), ASA I–II, scheduled for elective lumbar spine procedures under general anaesthesia in the prone position (e.g., lumbar fixation and simple discectomy). Exclusion criteria were patients with arrhythmia, heart failure, unstable angina, and decompensated respiratory disease (poor functional capacity, generalised wheezes, peripheral O2 saturation < 90% on room air); previous cardiac operations or cardiac catheterization; peripheral vascular disease or long-standing DM (more than ten years duration) or poor glycaemic control affecting PVI readings; complicated surgery (e.g., huge spine tumours, prolonged durations of more than 5 hours or surgery with massive blood loss).
Using computer-generated random numbers with closed envelops, the patients were allocated to two equal groups, each with 33 patients.
Conventional Group: 33 patients were in the CFM protocol.
PVI Group: 33 patients were in the PVI-based goal-directed fluid management protocol.
A preoperative visit was conducted on all patients the day before surgery to examine their medical condition and determine whether they met the inclusion and exclusion criteria listed above. As soon as the patient entered the operation room, monitors (ECG, pulse oximetry, and non-invasive blood pressure monitor) were applied and a premedication of 2 mg midazolam and 4 mg ondansetron was administered intravenously.
The Masimo SET “Mighty-Sat Fingertip Pulse Oxi-metry” (Masimo Corporation, Irvine, CA, USA model 9900) was attached to each patient in both groups on the dominant hand’s index finger; it contained neither the venous line nor the blood pressure cuff. We utilised the mean of three measurements of PVI and the perfusion index (PI) taken at one-minute intervals for each reading. We repeated the process after modifying the device’s settings three times if there was a significant amount of variability in the readings (changes in each of the three consecutive readings > 20%). But if there was still a significant amount of variability, we stopped the procedure and dropped the patient from the trial (fluid management for this case continued according to our routine institutional practice).
All patients received 100% oxygen while lying supine, and propofol (2 mg kg–1), fentanyl (1-2 µg kg–1), and atracurium (0.5 mg kg–1) were used to induce anaesthesia. After three minutes of mask breathing, an endotracheal tube was placed. Due to high stimulation, patients who required lengthy airway instrumentation because of difficult intubation were not included in the remaining data analysis. Afterwards, mechanical ventilation was carried out using a tidal volume of 6–8 mL kg–1 of the ideal body weight and an inspiratory–expiratory ratio of 1 : 2. To maintain an end-tidal carbon dioxide tension of 35–40 mmHg, the ventilatory frequency was changed.
Isoflurane (1–1.5%), atracurium (10 mg every 20 minutes intravenous increments), and morphine (0.1 mg kg–1 intravenous) were used to maintain anaesthesia. Following the administration of anaesthesia, the patient’s HR and mean arterial pressure (MAP) were measured while they were supine, free from any external stimuli. Three staff members then placed the patient in the prone position on a Wilson frame. Fluid infusion began immediately after anae-sthesia induction and was continued by the same anaesthesiologist according to the assigned group:
In the Conventional Group, Ringer solution was administered at a dosage of 5 mL kg–1 h–1 throughout the surgical procedure with monitoring of HR, MAP, and urine output. Hypotension was defined as a state in which MAP dropped to less than 70% of the preoperative baseline reading. In this instance, a bolus of 250 mL of crystalloids (0.9% NaCl) was provided, and if the hypotension persisted, 5 mg of IV ephedrine was given and repeated every 5 min until the MAP ≥ 70% of the baseline value.
In the PVI Group, a basal rate of infusion of Ringer solution at a dosage of 2 mL kg–1 h–1 was initiated. A 250-mL bolus of crystalloids was administered if the PVI was higher than 13% for more than 5 minutes. The PVI was repeated every 5 minutes until it fell to ≤ 13% after the bolus, and if the patient’s MAP dropped below 70% of the baseline value, 5 mg of intravenous ephedrine was administered and repeated every 5 minutes to keep the MAP ≥ 70% of the baseline value. In the cases where PVI was ≤ 13% and if MAP was below 70% of the baseline MAP of the patient, 5 mg of IV ephedrine was applied and repeated every 5 min to keep the MAP ≥ 70% of the baseline value.
Then the patient was turned to the prone position and the same steps according to PVI and PI readings were repeated (Figure 1).
In both groups, in case of oliguria, which is defined as a condition in which intraoperative urine production is less than 0.5 mL kg–1 h–1, a bolus of 250 mL of crystalloids (0.9% NaCl) was administered for treatment. Blood transfusions were initiated at a dose in accordance with the estimated blood loss when the total quantity of blood loss exceeded 20% of the total blood volume. The patient was excluded from the trial if there was significant massive blood loss (4 units of packed RBCs in one hour or replacement of 50% of the total blood volume in 3 hours).
At the end of surgery, neostigmine (0.05 mg kg–1 ) and atropine (0.02 mg kg–1) were used to reverse the remaining neuromuscular blockade, and patients’ tracheas were extubated after the airway reflexes had fully recovered. The patients were transferred to the post-anaesthesia care unit, where their MAP and HR were immediately measured, and they underwent a two-hour period of observation.
The primary outcome of this study was specified as the total amount of intraoperative crystalloid administered by each group. Secondary outcomes included intraoperative PVI and PI, MAP, HR, and the incidence of hypotension after prone positioning in both groups, as well as data from arterial blood gas samples (pH, arterial oxygen pressure (PaO2), arterial carbon dioxide pressure (PaCO2), HCO3, blood lactate levels) obtained after anaesthesia induction and immediately postoperatively in the recovery room.
Sample size
Our primary outcome was the amount of intraoperative crystalloid administered in patients undergoing elective lumbar spine surgery. A pilot study was performed by our team. We enrolled 10 patients, and the mean amount of intraoperative crystalloid administered was 2330 ± 900 mL. Power analysis estimated 62 patients, 31 in each group, with a research power of 80% and an alpha error of 0.05 based on the hypothesis that the use of the plethysmographic variability index would lower the quantity of intraoperative crystalloid administered by 25%. The sample size was determined using Med-Calc Software version 14 (Med-Calc Software, Ostend, Belgium). To account for potential dropouts, this number was increased to 66 patients (33 patients in each group).
Statistical analysis
SPSS Statistics version 25 was used for data ma--nagement and statistical analysis. Using the Shapiro- Wilk test, the data’s normality was investigated. The normally distributed data were expressed as mean standard deviation, whereas the non-normally distributed data were reported as median (25th–75th percentile). Categorical data were summarised as number (percentages). The independent t-test was used to compare the two groups in terms of normally distributed numerical variables.
If significant findings were obtained in numerical variables that were not normally distributed, the Mann-Whitney test was used as a post-hoc comparison. For intragroup comparisons (pairwise group comparison), normally distributed data were compared using the paired t-test and repeated measures ANOVA model, with the Wilcoxon signed rank test being utilised for non-normally distributed data. Differences between categorical variables were examined using the χ2 test and, when necessary, Fisher’s exact test. The paired t-test was used to compare changes brought on by changes in position. P-values were only considered significant if ≤ 0.05.
RESULTS
The eligibility of 80 patients was checked. 11 participants failed to satisfy the inclusion requirements, and 3 patients declined to take part in the trial, resulting in the exclusion of 14 individuals. The trial was completed by 66 patients, with 33 in each group (Figure 1). Except for sex, which was considerably greater in the PVI group compared to the conventional group, the demographic data and durations of the surgery were comparable between the two research groups (Table 1).
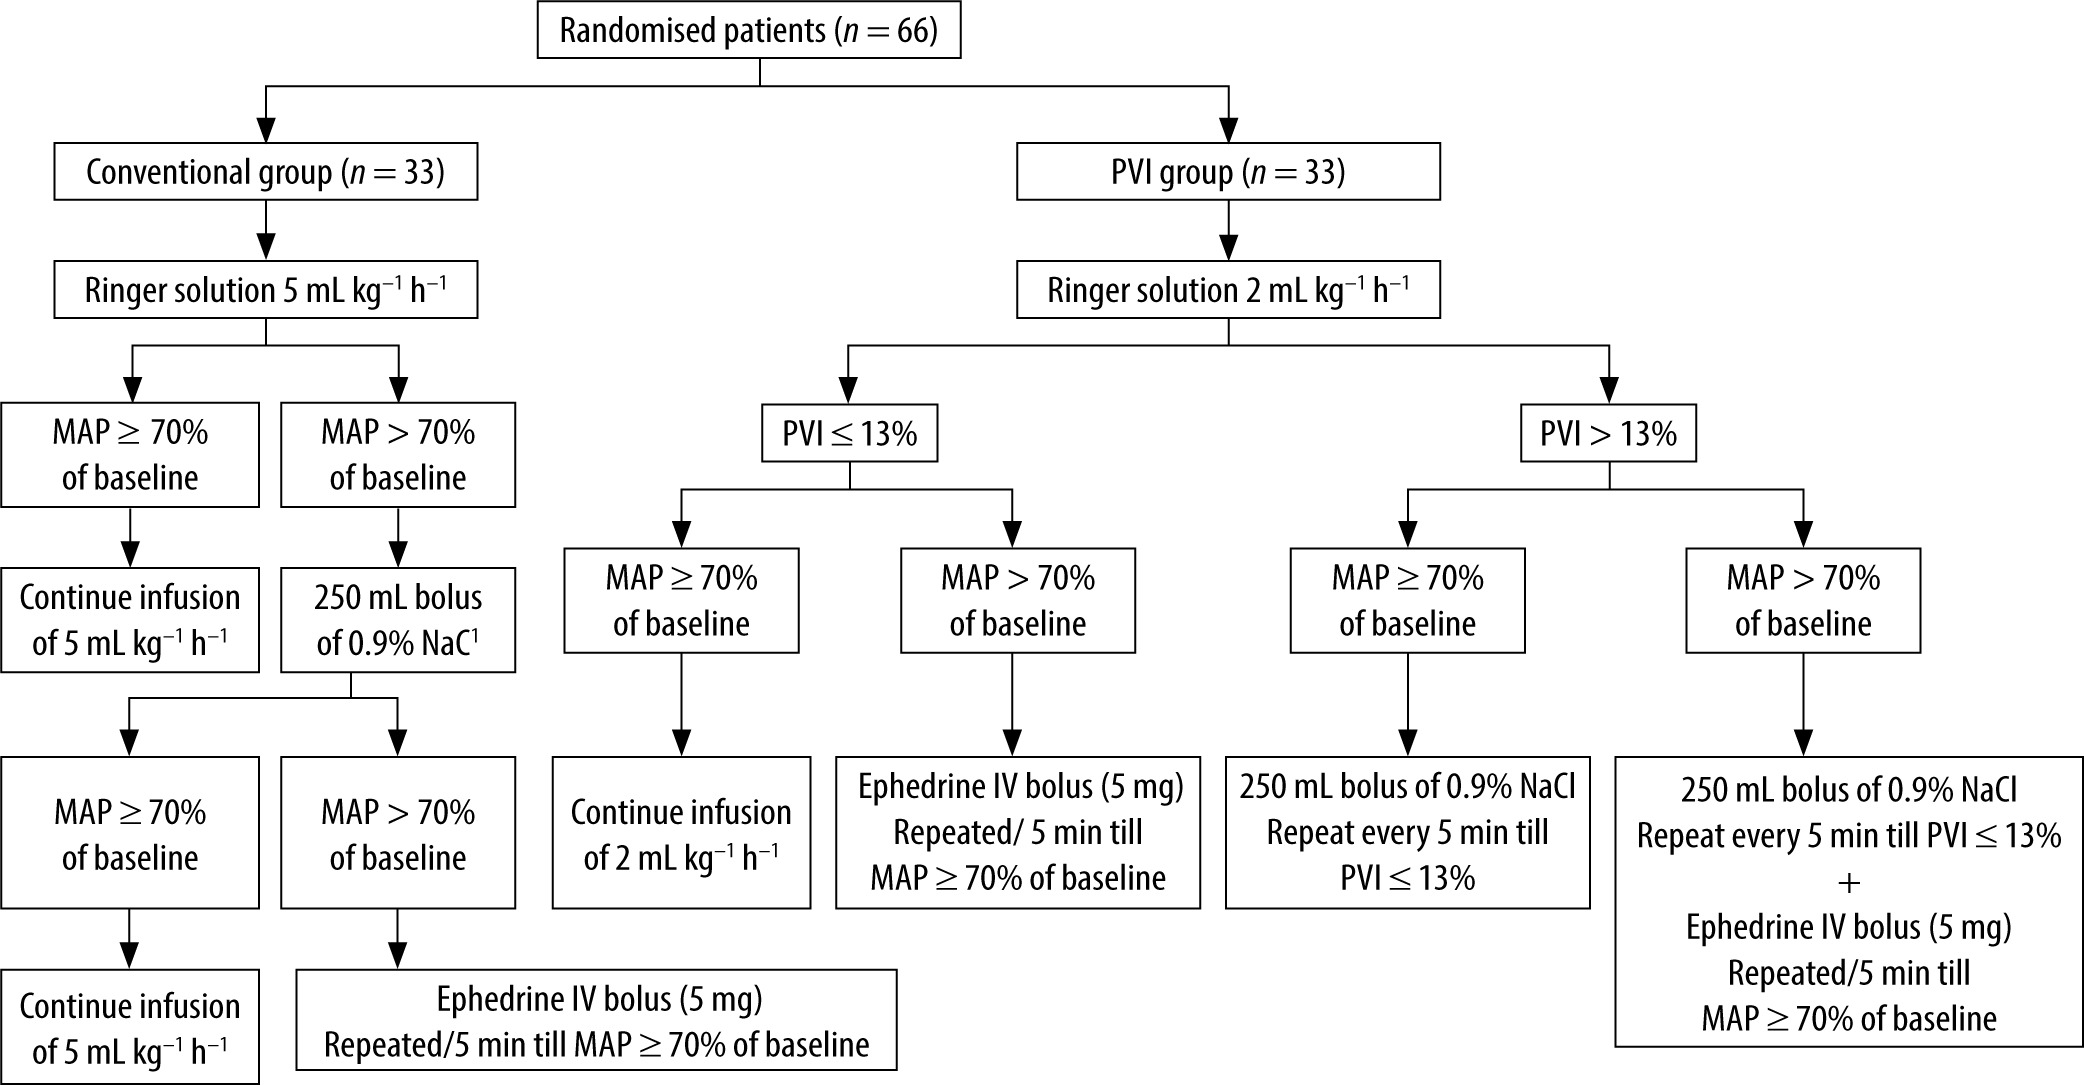
TABLE 1
Demographic data and baseline characteristics
The time from induction of anaesthesia to skin incision, the total duration of surgery, and anaesthesia were comparable in both groups. The total amount of intraoperative crystalloids, blood transfusion, urine output, and fluid balance were similar in both groups. Only one patient in the PVI group received one unit of blood transfusion (300 mL). The total number of patients who experienced oliguria and received ephedrine boluses was higher in the PVI group. However, these values did not reach statistical significance (Table 2).
TABLE 2
Intraoperative features
[i] Data of time to skin incision, duration of anaesthesia and surgery are presented as mean and mean ± standard deviation. Data of intraoperative crystalloids, blood transfusion, urine output and amount of intraoperative ephedrine are presented as median (25th–75th percentile). Fluid balance is presented as median (25th–75th percentile) (maximum, minimum). Number of patients who had oliguria and received ephedrine is presented as number (%).
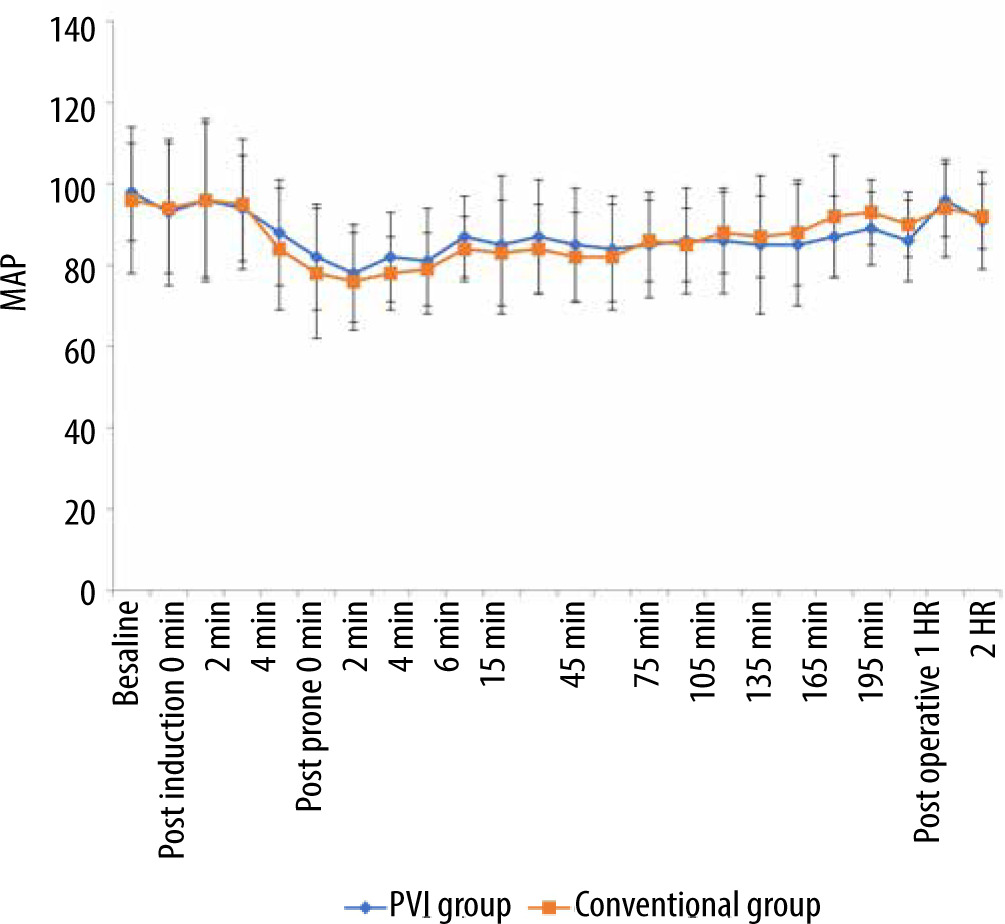
The perioperative MAP values showed non-significant differences between the two groups at all time points of measurements (Figure 2). However, there was a statistically significant decrease in intraoperative values compared to the preoperative baseline values in all time points except at the post-anaesthesia induction times, the 195th minute and postoperatively in both groups, and the 135th, 150th, 165th, and 180th minutes in the conventional group.
FIGURE 2
Preoperative, intraoperative, and postoperative mean arterial pressure (MAP) values in both groups
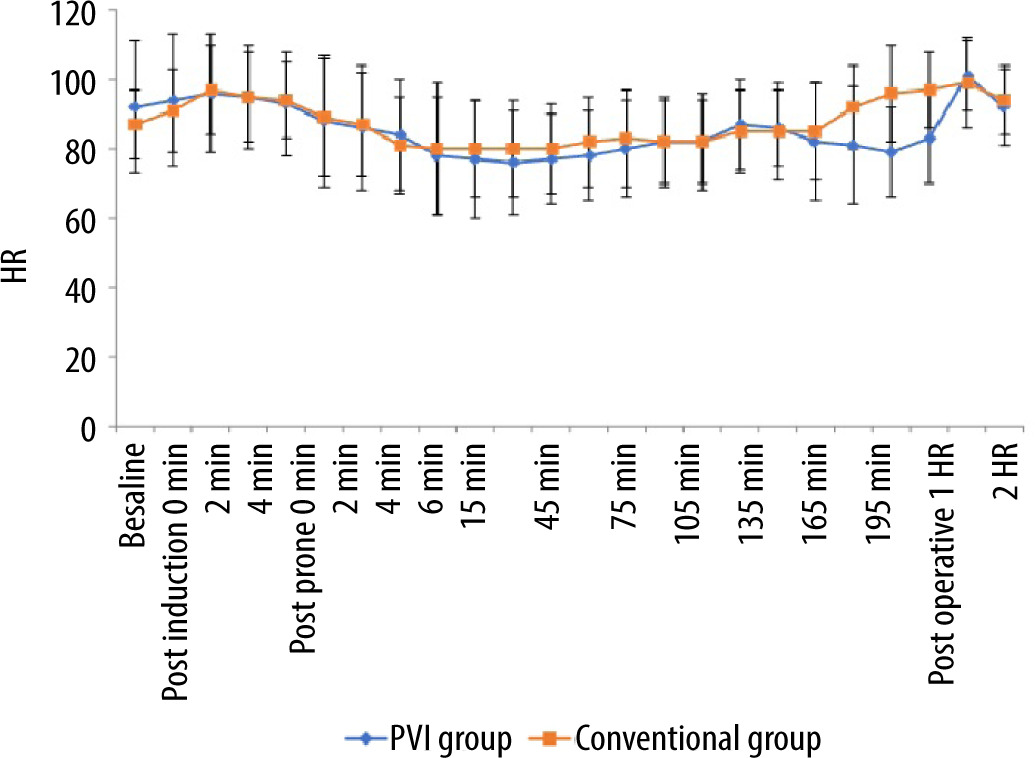
Similarly, the perioperative heart rate values showed nonsignificant differences between both groups in all time points of measurements (Figure 3). However, there was a statistically significant decrease in intraoperative values in each group compared to the preoperative baseline values at all time points except at 0 and 4 minutes post-anaesthesia induction, 0 and 2 minutes post-prone position, the 135th minute and 2 hours postoperatively in the PVI group and at 0 minutes post-anaesthesia induction, 2, 4 and 6 minutes post-prone position, and the 135th, 150th, 165th, and 180th minutes in the conventional group.
An arterial blood gas sample was withdrawn from patients in both groups immediately after induction of anaesthesia (T1) and immediately postoperatively in the recovery room (T2). The values of pH, PaO2, PaCO2, HCO3, lactate and haemoglobin showed no statistically difference between the two groups. The blood lactate value at T2 was significantly increased when compared to the T1 value in the two groups (Table 3).
TABLE 3
Arterial blood gas data in post-anaesthesia induction and 1st hour postoperative times
Different haemodynamic variables in each group before and after prone positioning were compared, showing a statistically significant decrease in the mean and diastolic blood pressure in the two groups and systolic blood pressure in the conventional group (Table 4). Both groups were pooled in a single analysis to demonstrate the haemodynamic effect of changing posture, showing a significant decrease in systolic, diastolic, and mean arterial blood pressure with change in position (Table 5).
TABLE 4
Comparison of haemodynamic changes with prone positions
TABLE 5
Comparison of haemodynamic changes with prone positions in the studied patients
DISCUSSION
The main findings of this study are that the use of PVI dependent goal directed therapy did not reduce the intraoperative total crystalloid administration or requirements for blood transfusion when compared to conventional fluid management using a fixed fluid rate in patients undergoing spinal surgery in a prone position, even though the number of patients requiring ephedrine boluses was higher in the PVI group compared to the conventional group.
The nonsignificant results of this study might have been influenced by several variables. First, there were significantly more females in the PVI group than in the conventional group. According to earlier studies, general anaesthesia increases the risk of hypotension in the female population [15]. Second, although this difference did not achieve statistical significance, the PVI group experienced longer anaesthesia and surgical durations than the conventional group.
PVI is one of the dynamic variables that optimises intraoperative fluid management through fluid responsiveness by measuring changes in the PI during the respiratory cycle and correlating closely with variations in pulse pressure. It has been shown to predict fluid responsiveness in intensive care or during cardiac and general surgery with full haemodynamic monitoring [16–19].
The validity of PVI as an indicator of fluid responsiveness was demonstrated by Zimmermann et al. [20], who compared the accuracy of arterial pressure-based stroke volume variation and PVI waveform amplitude with central venous pressure to predict their responsiveness to volume replacement in mechanically ventilated patients undergoing major surgery.
Forget et al. [21] determined that PVI dependent goal-directed therapy results in less crystalloid and lower postoperative lactate levels when compared to conventional fluid therapy in patients undergoing major abdominal surgery, although there was no statistically significant difference between the two groups regarding the clinical outcomes and complications.
When compared to oesophageal Doppler stroke volume measurement fluctuation, Hood et al. [22] evaluated PVI’s effectiveness in patients undergoing colorectal surgery and revealed that PVI had a modest capacity to predict fluid responsiveness during surgery in ventilated patients.
However, Konur et al. [23] investigated the validity of PVI as a predictor of fluid responsiveness in orthotopic liver transplantation in comparison to invasive haemodynamic indexes, including the cardiac index determined by intermittent transpulmonary thermodilution, pulse pressure variation, systemic vascular resistance index, and stroke volume variation that are measured using the PiCCO2 monitoring system, and reached the conclusion that PVI was insufficient. This outcome could be explained by the patient’s hepatic status (ASA III–IV), substantial fluid shift, high peripheral perfusion variability, and frequent use of vasoconstrictors during major surgery.
Similar findings were obtained in Liu et al. [24] meta-analysis of 25 trials and 975 patients on mechanical ventilation. The area under the receiver operating characteristic (AUROC) curve for predicting preload responsiveness was 0.82 (95% confidence interval [CI]): 0.79–0.85). The combined sensitivity and specificity were 0.77 (95% CI: 0.67–0.85) and 0.77 (95% CI: 0.71–0.82), respectively. The subgroup of patients who did not have surgery had reliable findings (AUROC = 0.86, Youden index = 0.65), whereas ICU patients’ outcomes (AUROC = 0.89, Youden index = 0.67) demonstrate that the reliability of the PVI is limited to ICU mechanically ventilated patients who are not undergoing surgery.
In patients undergoing elective colorectal surgery, Cesur et al. [14] compared the conventional and PVI protocols of fluid management. They reported that the PVI group had a shorter time to pass stools and less intraoperative total crystalloid administration, but still no difference in the length of hospital stays or postoperative complications.
Blood lactate levels serve as a metabolic marker for organ perfusion and are correlated with tissue hypoxia, surgical complications, and hospital stay duration. In our research, both fluid management techniques had a comparable impact on lactate levels, with PVI group lactate levels non-significantly higher than the Conventional group in both post-general anaesthetic induction and postoperative samples.
Additionally, the postoperative samples from both groups showed a statistically significant increase in blood lactate levels, with the post-general anaesthesia sample being slightly higher than the normal reference values (0.5–2 mmol L–1). Forget et al. [21] and Cesur et al. [14] demonstrated reduced intraoperative and postoperative lactate levels in PVI-based goal-directed fluid management compared to conventional fluid management.
Another intriguing finding of this study is the substantial change in SAP, DAP and MAP of all patients after shifting from a supine to a prone position. PVI did not alter statistically significantly. This may be due to physiological changes in the respiratory and cardiovascular systems spurred on by utilising the Wilson frame, which led to increased intra-abdominal pressure and, in turn, increased inferior vena cava pressure, which promoted venous pooling and diminished venous return. In addition to raising central venous pressure, increased thoracic pressure reduces left ventricular compliance and filling, which reduces ventricular capacity, stroke volume, and the cardiac index [25]. In addition, increased intra-abdominal pressure causes a decrease in the compliance of the respiratory system and an increase in airway pressure, which can also reduce both venous return and cardiac output [26].
In a previous study using transoesophageal echocardiography to detect changes in haemodynamic and cardiac functions after placing patients in different positions, the decrease in cardiac output and stroke volume with the Wilson frame was likely due to the increase in myocardial wall tension associated with increased afterload caused by reduced chest wall compliance [27].
The AUROC curve for PVI in patients in the prone position was shown by Kim et al. [28] to be somewhat smaller (0.756, 95% CI: 0.618–0.863, P = 0.001) than in patients in the supine position (0.814, 95% CI: 0.684–0.908, P = 0.001). The use of vasoactive medications, hypothermia, and surgical stress might all contribute to peripheral vasoconstriction and lower PVI sensitivity when in the prone position [29].
Backofen [30] evaluated the variations in cardiac index between the prone and supine positions and concluded that the cardiac index was reduced by 24% in the prone position. However, the patient’s blood pressure remained unchanged.
From the supine to the prone position, Apar et al.’s research [31] demonstrated no statistically significant change in heart rate, systolic, or diastolic blood pressure, while the perfusion index significantly decreased when the patient’s posture was changed from supine to prone.
This study has some limitations, including a small sample size that makes it difficult to determine the true impact in both groups and a failure to examine the impact of PVI-guided fluid management on lactate levels, which are more reliable indicators of postoperative complications and length of hospital stay between 12 and 24 hours postoperatively. The fact that the investigator was not blind throughout the intraoperative period was another research constraint. Another limitation is that the duration of surgery and of anaesthesia differed somewhat between both groups, with more of the PVI group having longer durations despite not reaching statistical significance on comparing both durations, which may affect the comparison of MAP and HR in the late intraoperative time points (after 150 minutes intraoperatively). Future studies are recommended using a larger sample size.
It is recommended that future research investigate the effects of PVI dependent goal-directed fluid management in major surgery with huge blood loss and fluid shift on lactate levels for 24 hours postoperatively and on length of hospital stay employing larger sample sizes, including critically ill patients.